SCIENTIFIC ACTIVITY (2009)
Lay abstract – Sommario divulgativo
Il progetto di ricerca ha come obiettivi l’individuazione e la definizione delle basi metodologiche e lo sviluppo di un’infrastruttura computazionale per lo studio dei meccanismi molecolari che determinano, in generale, gli stati fisio-patologici delle cellule e, in particolare, la plasticità del tessuto muscolare. Durante il secondo anno del progetto è stata consolidata l’infrastruttura computazionale e sono stati applicati i sistemi di calcolo per analizzare dati genomici relativi a sistemi biologici complessi. Questi strumenti bioinformatici, sfruttando le potenzialità delle tecnologie dell’informazione, hanno permesso di studiare l’attività dell’intero genoma umano nelle cellule, in condizioni normali e patologiche, senza dover ricorrere a nuovi esperimenti di laboratorio. Integrando al computer i risultati di migliaia di esperimenti con chip a DNA o microarray, sono state ottenute delle istantanee dell’espressione genomica in tipi cellulari diversi. In particolare, nelle cellule muscolari, la comparazione di queste impronte genetiche ha fornito importanti indicazioni sui meccanismi molecolari che caratterizzano gli stati fisiologici del muscolo sano, giovane, allenato, malato, o nell’invecchiamento. Le potenzialità scientifiche del Progetto di Eccellenza sono state amplificate dalla collaborazione con il gruppo del Prof. Stefano Piccolo, responsabile del progetto Targeting tgf-β signaling in cancer, finanziato dalla Fondazione nello stesso Bando Progetti di Eccellenza 2006. Nello specifico, l’azione sinergica tra i due progetti ha permesso di pervenire a un importante risultato scientifico, testimoniato dalla pubblicazione sulla prestigiosa rivista Cell ( http://www.unipd.it/comunicazioni/stampa/comunicati/20090403.htm). L’utilizzo dell’infrastruttura bioinformatica e lo sviluppo di programmi per il recupero automatico di migliaia di campioni da banche dati pubbliche e per la loro organizzazione e analisi hanno permesso, infatti, di individuare dei geni indicatori capaci di rivelare la presenza, o meno, di un gene, p63, che il gruppo del Prof. Piccolo ha caratterizzato come baluardo contro la diffusione metastatica delle cellule tumorali. Queste nuove spie molecolari sono potenzialmente utilizzabili in ambito clinico per lo sviluppo di percorsi diagnostici, indicatori prognostici e nuove terapie personalizzate che riconoscano p63 come bersaglio molecolare. Infine, l’intervento della Fondazione per il finanziamento di una borsa di Dottorato di Ricerca nel campo della bioinformatica post-genomica e della modellazione del funzionamento cellulare (Scuola di Dottorato di Bioscienze, indirizzo di Genetica e Biologia Molecolare dello Sviluppo) ha permesso di potenziare le competenze biomediche ed ingegneristiche, ottenendo risultati rilevanti nel campo della systems biology. In particolare, i metodi computazioni sviluppati nell’ambito del progetto hanno permesso di ricreare un modello ingegneristico del funzionamento delle cellule di mieloma multiplo attraverso la ricostruzione della prima rete regolativa post-trascrizionale nei mielomi. I risultati di questa ricerca sono stati recentemente pubblicati sulla rivista Blood (http://www.unipd.it/comunicazioni/stampa/comunicati/20091110b.htm).
Scientific report
The following pages report the scientific activity according to the tasks originally planned for the central part of the project (months 19/29; see Table 1 and Figure 1 of the original proposal). All tasks have been addressed and completed within the allotted time. In some areas, results are more advanced than originally planned, especially for what concerns the reconstruction of regulatory networks. All activities and results (including software, annotations, manuscripts, etc) are illustrated and freely available at the project web site http://compgen.bio.unipd.it/bioinfo/cariparo/.
Task 1. EXPERIMENTAL MODEL: THE SKELETAL MUSCLE
The skeletal muscle tissue constitutes the experimental model and the biological focus of the project, with
the applicative aim of investigating and modeling networks of regulatory interaction in healthy and diseased
muscle cells. During the second year of the project, we investigated muscle physiology alterations in i) muscle atrophy, ii) muscle dystrophy, and iii) muscle Dexamethasone treatment.
As a first pilot-study, previously available gene expression signatures have been analyzed through a metaanalysis approach to decipher gene interaction networks in early and late stages of muscle atrophy (Calura et
al., 2008 - labeled Highly Accessed by BMC Genomics). Our study offered a general overview of the molecular pathways and cellular processes regulating the establishment and maintenance of atrophic state in
skeletal muscle and showed how the different pathways are interconnected. This analysis also identified
novel key factors that could be further studied as potential targets for therapeutic purpose. We highlighted
how SMAD3/4, RACK1, MYC, MAX and JUN transcription factors, whose functions have been studied extensively in tumors but only marginally in muscle, appear to play important roles in regulating muscle response to atrophy.
In the second study, we proposed a new technique to combine molecular and clinical data for a deeper comprehension of the biological pathways involved in the muscle physio-pathological state (Romualdi et al.,
2009). In microarrays studies, clinical and expression data are always considered as separate dimensions of
the same phenomenon. In general, only gene expression dimension is analyzed maintaining its intrinsic complexity, while the complexity of clinical data is usually collapsed to a single main dimension (prognosis, survival, response to a given therapy). However, we think that a better comprehension of a pathological phenotype can be obtained only if both types of data can be combined and integrated so to dissect the single components of a complex picture. Our strategy, based on dimension reduction and correlation analysis, has been
tested on three different types of muscle dystrophies, i.e. congenital muscular dystrophy (MDC), limb-girdle
muscular dystrophy type 2B (LGMD2B) and facio-scapulo-humeral dystrophy (FSHD). Muscular dystrophies are heterogeneous disorders characterized by progressive degenerative changes in skeletal muscle fibers. However, despite the knowledge of primary genetic defects, the molecular pathways leading to muscle
cell degeneration are poorly understood. Using our approach we found an interesting separation between biological effects as inflammatory muscle response to the disease and the severity of disease progression. Comparing our methodology with a general supervised inferential approach we better-characterized different
physio-pathological aspects of the dystrophies, aspects impossible to be separately identified by a classical
supervised approach.
In the last study, genome-wide microarray technology has been applied to investigate the effect that low dosage dexamethasone (Dex), alone or in association with estrogens, has on the muscle physiology of an animal
model (Carraro et al., 2009). Although dexamethasone is often illegally administered at very low dosage as a
growth promoter, several studies showed an increase in the expression of GDF8 (myostatin) gene, a wellknown negative regulator of skeletal muscle mass, in a dose-dependent way. This suggested a direct role of
myostatin in Dex-induced muscle wasting. Our analysis demonstrated that the gene expression profiles were
strongly affected by the dexamethasone treatment with hundreds of genes up-regulated and only seven genes
(including the myostatin) down-regulated. Differentially regulated genes were analyzed to describe the effects of these treatments on muscle physiology, highlighting the importance of specific pathways (e.g., Wnt
or cytokine signaling) and cellular processes (e.g., cell shape and motility).
Task 2. INTEGRATED DATABASE
The following issues have been finalized in this task:
- refinement and application of A-MADMAN, a software tool for the retrieval, annotation and analy sis of gene expression data (Bisognin at al., 2009);
- development of custom chip definition files for platform annotation and matching in the light of genomic data integration (Ferrari et al., 2007; Sales et al., 2010);
- critical assessment of different normalization strategies for meta-analysis of gene expression data (Chiogna et al., 2009; Risso et al., 2009 - labeled Highly Accessed by BMC Bioinformatics);
- definition of a novel strategy for the integration of miRNA and mRNA signals;
- selection and retrieval of muscle gene expression datasets.
Task 2.1. Selection and retrieval of muscle gene expression datasets
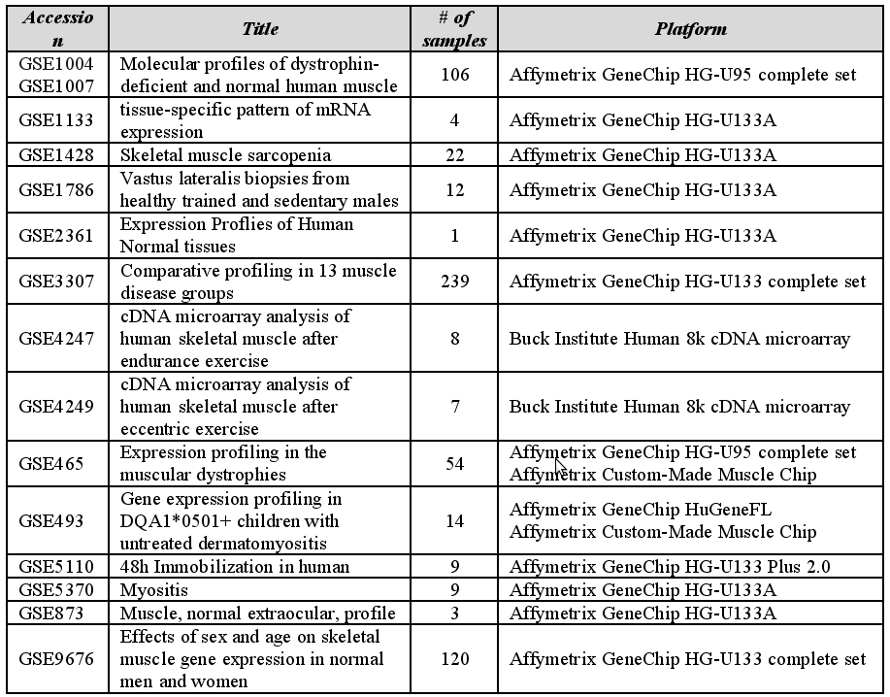
Data pertaining to a total of 608 gene expression experiments have been retrieved from GEO public repository and used to populate a custom-created database (Table 1). The database accounts for gene expression
data of muscle tissues obtained from healthy individuals of different age, which have been classified in infant, young, adult and old, in normal conditions, comprising untrained and trained people (some samples
were taken after different kinds of training exercises), or after immobilization. Different kinds of muscle diseases are also represented in the integrated database. A custom annotation tag-system, focused on muscle
physiology and on selected samples characteristics, has been designed and adopted for sample annotation.
Single or multiple samples have been assigned to specific individuals/patients by hand-curate literature mining. Data and metadata were automatically retrieved and organized using A-MADMAN, a tool explicitly developed for retrieval, annotation and analysis of muscle gene expression data.
Table 1. List of series available in the muscle database.
Task 2.2. Data warehousing, preprocessing and low level analysis of expression data
The classical meta-analysis approach to gene expression data considers results from each data set and then
combines the significance of the test at a posterior level. However, due to the high cost and low reproducibility of many microarray experiments, it is not surprising to deal with a limited number of samples in each
study, thus lowering the power of the statistical inference. Therefore, it is of great interest to retrieve and
merge data sets from multiple studies, prior to the statistical analysis, to increase the sample size and the
power of the statistical test. To fulfill the lack of software tools for gene expression data retrieval and integration and the methodological gaps in the meta-analysis approaches, we developed novel software, named
A-MADMAN, and critically assessed several normalization strategies for meta-analysis.
A-MADMAN (Annotation-based MicroArray Data Meta ANalysis tool) is a software tool to retrieve, annotate and manage gene expression data (Bisognin et al., 2009 - labeled Highly Accessed by BMC Bioinformatics). The rationale behind this tool is automating the tedious and error-prone steps necessary to setup a working environment for the meta-analyses of expression data. From a technical point of view, A-MADMAN is a
web application written in Python, based on the Django web framework with GNU R as a backend. At the
current state, A-MADMAN offers the following features:
- automatic download and organization in a proper and transparent file-system hierarchy of GEO and proprietary raw data and annotations given a textual configuration file;
- automatic import of metadata from GEO records into a local relational database to assist subsequent manual annotation and selection of samples;
- flexible annotation of samples through user-defined tags;
- selection of samples to be analyzed using a complex logical query on tags;
- low level analysis of expression data using the R backend powered by Bioconductor packages. The basic analysis has been properly refined from its original version to comprise the following steps:
- creation of a working directory named after the analysis;
- copy of the selected CEL files to the working directory;
- definition of a custom and virtual microarray grid (meta-platform) containing only probes that are shared between two or more Affymetrix platforms;
- signal reconstruction using RMA algorithm and custom (or meta) chip definition files (Ferrari et al., 2007);
- transfer of metadata to Bioconductor ExpressionSet objects;
- alternative normalization of the final ExpressionSet with distribution transformations (Chiogna et al., 2009).
Task 2.3. Platform annotation and matching
The integration of different chip platforms is carried out using custom Chip Definition Files (CDF) and annotations or defining a virtual microarray grid (meta-platform) and meta-CDFs. In addition to the set of custom CDFs previously described (Ferrari et al., 2007), we developed a computational pipeline to merge different platforms (e.g. U133A, U133Av2 and U133Plus2.0) into a virtual microarray layout, where shared
probesets/probes are located in controlled coordinates of the microarray grid. The procedure, coded in an R
function (MetaMetaCDF_rma.R), implements the meta-platform definition, the CEL file transformation, the
data pre-processing and the meta-meta normalization. It’s worthwhile noting that the background correction
and the probe summarization steps are still performed independently for each data set, as previously reported. This novel pipeline is already supported in all versions of A-MADMAN (Ferrari et al., manuscript in
preparation).
We finally addressed the issue of probe annotations in the context of the integrative analysis of miRNAmRNA expression profiles for miRNA target refinement. Details of 3’UTR custom CDFs are described in
Task 2.5 Functional annotation of muscle genes.
Task 2.4. Statistical inference on muscle gene expression datasets
The computational analysis of the retrieved and normalized datasets has been postponed to the last phase of the project, i.e., after completing the validation of all computational pipelines. Nevertheless, all functions to interface A-MADMAN database with the most commonly used tools for unsupervised and supervised analysis (i.e., Principal Component Analysis, Canonical Variate Analysis, SOM, k-mean, hierarchical clustering, moderated t-test, SAM, and rank-product) are already in use. Indeed, we decided to convert all sample metainformation of A-MADMAN into a sample information file, i.e., matrix that can be easily saved in a tabdelimited text file and subsequently edited in Excel to be adapted to any unsupervised or supervised method. Similarly to dChip, the first header line is required. The first two columns are also required and they are the array file names and the corresponding sample names, as coded in A-MADMAN. The sample names should be different for each array and also be different from any array names. All other columns contain the labels used to tag each sample in A-MADMAN, thus resulting in a very useful schema to later perform supervised or unsupervised analyses (e.g., enriched sample clustering or selection of sample by categories).In addition to what originally planned for this task, we further explored the integrated analysis of microRNAs (miRNA) and genes expression data for reconstructing post-transcriptional regulatory networks. This addition finds its rationale in the recent popularity achieved by miRNA as regulators of genomic transcription and by the availability of paired miRNA-mRNA expression data. The pipeline to reconstruct a posttranscriptional regulatory network requires to i) identify the miRNA target genes basing on computational predictions; ii) select the target relationships supported by miRNA and mRNA expression data; iii) compute the Pearson correlation coefficient of the expression levels of target genes sharing at least one supported miRNA-target relationship; iv) reconstruct the post-transcriptional regulatory network from the adjacency matrix S of regulatory relations supported by miRNA and mRNA expression levels. Computational prediction of miRNA targets still presents significant challenges due to the lack of a sufficiently large group of known miRNA targets to be used as training set. As such, most computational algorithms for target prediction (miRanda, TargetScan, PicTar, PITA, RNAhybrid) result in a significant proportion of false positives, i.e. in the prediction of not-functional miRNA-mRNA interactions. Given the increasing experimental evidences supporting the miRNA mechanism of target degradation, the integration of in-silico predictions with miRNA and target gene expression profiles has been proposed as a method to select functional miRNAmRNA relationships. Since miRNAs tend to down-regulate target mRNAs, the expression profiles of genuinely interacting pairs are expected to be anti-correlated. This integrative analysis can be performed using a variational Bayesian model (Huang et al., 2007) or, as in this case, through a non-heuristic methodology based on the anti-correlation between miRNA and mRNA matched expression profiles. Specifically, miRanda algorithm was applied to predict miRNA targets from the human miRNA sequences and transcripts of miRBase Release 12.0 and ENSEMBL Release 52, respectively. Targeting predictions were retained if the miRanda score was higher than 160. The Pearson correlation coefficient of expression vectors was calculated for each miRNA-gene pair scored as potentially interacting according to the prediction of miRanda and used as an estimator of the functional activity of miRNAs on predicted target genes. Genes were considered genuine miRNA targets only if included within the top 3% of all anti-correlated pairs. This selection gave rise to a final adjacency matrix S of regulatory relations supported by expression levels (Biasiolo et al., 2010; Lionetti et al., 2009).
Due to the complexity and to the computational demand typical of this type of integrative analysis, we have planned to develop a dedicated web tool, called MiRNA And Genes Integrated Analysis (MAGIA), for the integration of miRNA and mRNA expression profiles (Sales et al., manuscript in preparation).
Task 2.5. Functional annotation of muscle genes
The availability of experimental data measuring the abundance of protein-coding transcripts and miRNAs in
the same biological samples provides the opportunity to investigate the details of post-transcriptional regulation. However, the standard experimental set-up is based on traditional microarray platforms, a design that in
this context presents two criticalities. First of all, such devices were designed a number of years ago; since
then our knowledge of genome annotation has improved dramatically so that a significant fraction of microarray data are no longer accurate or associable to the originally intended genes. Then, strong evidences
have been presented in the literature backing the hypothesis that the regulatory interactions between messenger and miRNAs are limited to the 3'UTR regions of the formers. This would mean that such regulation is
actually transcript-specific and that microarrays associating signals to a gene (rather than to only one of its
transcripts) may not provide a sufficient resolution to investigate the problem at hand.
With these issues in mind, and in addition to the gene-centered CDFs (Ferrari et al., 2007), we developed
3’UTR custom CDFs for probe annotation with the aim of improving the miRNA target prediction through
the integrative analysis of miRNA-mRNA expression profiles. Indeed, the bioinformatics prediction of
miRNA-mRNA binding interactions still represents a computational challenge that can be improved through
the integrative analysis of paired miRNA-mRNA expression profiles. The integration of in-silico predictions
with other genomic data may overcome the limits of computational predictors and facilitate the identification
of functional interactions. However, differently from the standard analysis of gene expression profiles, when
considering the integrative analysis of miRNA and mRNA data, the concept of transcript must replace that of
gene in all steps of the computational pipeline. Given that a considerable fraction of microarray probes can
be i) entirely mis-assigned (not associated to any gene/transcript in a recent genome annotation version), ii)
non gene-specific (i.e. matching multiple genes), or iii) non-transcript-specific (matching multiple alternative
transcripts of a gene), we investigated how different microarray probe annotations affect the integrative
analysis of miRNA-mRNA expression profiles. The analysis has been performed through a computational
pipeline that i) re-annotates microarray probes into gene- and transcript-based custom CDFs; ii) uses sequences of transcripts and miRNAs to predict miRNA targets; iii) integrates miRNA target predictions with
paired miRNA-mRNA expression signals. Specifically, we explored the degree of specificity of miRNA seed
pairing to alternative 3’UTR isoforms of genes and then compared miRNA-mRNA expression correlation,
using both gene- and transcript-based probe annotations. We constructed 3’UTR custom CDFs for the most
commonly used Affymetrix arrays using ENSEMBL, RefSeq and AceView sequences. When applied to the
analysis of paired miRNA-mRNA expression, the 3’UTR custom CDFs allowed generating wellcharacterized signals for both genes and all their transcripts. Moreover, results highlighted that microarray
probe annotation has a substantial impact when paired miRNA-mRNA expression data are used to detect real
miRNA-target interactions and that the use of a transcript-based annotation outperforms the use of genebased ones (Sales et al., 2010).
Task 2.6. Database structure
The muscle database is under completion.
Task 3. IDENTIFICATION OF GENOMIC FEATURES LOCAL ENRICHMENTS AND OF DIFFERENTIALLY EXPRESSED CHROMOSOMAL REGIONS
In this task, we optimized previously developed algorithms to detect density variations of specific features
along the genome sequence and chromosomal regions with structural and transcriptional imbalances (Coppe
at al., 2006; Callegaro et al., 2006; Bicciato et al., 2009). Briefly, the methodologies so far adopted were
mainly based on the LAP algorithm (Callegaro et al., 2006). Further extension of this approach have shown
to be effective in identifying i) specific genomic regions with global gene expression variation and ii) genes
and genomic regions with coordinated expression profiles both in human and in other genomes, as well as
iii) coordinated variation of multiple types of genomics data. Nevertheless, methodological refinements of
the previous approaches were required to overcome some computational limitations and to increment the robustness of the analysis. As such, in the context of a research project activity funded by HPC-Europa2 (PanEuropean Research Infrastructure on High Performance Computing), Dr. Francesco Ferrari was hosted for 2
months at the Center for Human and Clinical Genetics - Leiden University Medical Center – where, under
the supervision of Prof. Judith Boer and the collaboration of Dr. Aldo Solari, entirely revised all LAP-based
procedures. Briefly, Dr. Ferrari and Dr. Solari addressed several statistical issues and provided methodological improvements for what concerns i) the permutation schema adopted to evaluate the significance of results; ii) the methodology used for data non linear regression with adaptive bandwidth; iii) the possibility of
incorporating additional data or genomic information into the underlying statistical model. The availability
of HPC-Europa2 computational resources allowed testing the methodological refinements on large simulated
datasets and quantifying the algorithm performances (in terms of sensitivity and specificity) in the analyses
of different types of genomic data. The modifications were mainly aimed at improving the sensitivity of the
analysis, particularly focusing on the sensitivity in detecting small significant genomic regions and at controlling false positive results. The research work resulted in a dedicated R package (PREDA: Position RElated Data Analyisis) for the analysis of position related data (Ferrari et al., manuscript in preparation).
In the next phase of the project, PREDA will be applied to identify specific classes of genes, which are i) always expressed in muscle; ii) differentially expressed in specific conditions or groups of conditions; iii) coexpressed in the considered conditions.
Task 4. RECONSTRUCTION OF INTEGRATED REGULATORY NETWORKS
4.1. Methods and algorithms for network reconstruction and analysis
In the course of the second year of the project, we implemented the computational pipeline to generate and inspect transcriptional and post-transcriptional regulatory networks, reconstructed from mRNA and miRNA expression data (Biasiolo et al., 2010). The entire pipeline has been optimized on a dataset of multiple myeloma samples and will be applied as is to the muscle database during the final phase of the project. Briefly, the transcriptional and post-transcriptional networks have been reconstructed using a parallelized version of ARACNe and the Pearson correlation coefficient of the expression vectors of miRNA target genes, respectively. ARACNe utilizes information and data transmission concepts (i.e., mutual information and data processing inequality) to identify statistically significant co-regulations among genes from microarray expression profiles. Mutual information and data processing inequality allow reconstructing gene-gene relationships which most likely represent either direct regulatory interactions or interactions mediated by posttranscriptional modifiers. Briefly, the algorithm first uses the expression data to calculate pair wise Mutual Information (MI) through a computationally efficient Gaussian kernel estimator. ARACNe calculates the kernel width depending on the size and statistics of the dataset. The second step is the elimination of the interactions that are not statistically significant according to a p-value or a MI threshold and returns a series of irreducible statistical dependencies. The post-processing step eliminates interactions that are likely to be indirect. The Data Processing Inequality (DPI) theorem removes indirect regulatory influences that appear as direct because of a high MI score due to the presence of a common neighbor. An additional parameter, called DPI tolerance, can be used to compensate for errors in the MI estimate that might affect DPI application. The parameters of the kernel width and the Mutual Information threshold were calculated using MATLAB scripts. The p-value to determine the MI threshold was set at 1e-7, while the DPI tolerance was set equal to 10%. A list of Transcription Factors (TF) was also imputed as a parameter to prevent the DPI from removing transcriptional interactions in favor of non-transcriptional ones (interactions between two non-TFs). The post-transcriptional regulatory network was reconstructed from the adjacency matrix S of regulatory relations supported by miRNA and mRNA expression levels. The procedure to obtain the matrix S is described in Task 2.4. Statistical inference on muscle gene expression datasets. The adjacency matrix S defined a bipartite directed network with two types of nodes (miRNAs and mRNAs) connected by directed edges, each representing a probably functional regulatory effect of a miRNA on a target gene. The same matrix S was used to derive a gene-only network in which genes (nodes) are connected by undirected weighted links and the edge weight quantifies the number of shared miRNAs regulating each gene pair.Both networks showed a scale free structure, i.e. a type of structure reported with evidence in lower organisms, but still argument of debate in eukaryotes. The connectivity plots strengthen the hypothesis that the structure of human interaction networks has a scale free nature with a saturation effect already described in other scale-free networks, when the maximum connectivity range is below 1000. Both networks are also slightly assortative, meaning that they tend to have an aristocratic behavior where nodes with high degree tend to connect with nodes with similar degree. This suggests a hierarchical control mechanism.
Task 4.2. From integrated data, to biologically relevant gene-gene relationships encoded in the integrated network
The topological structure of a network can be used to identify the components (nodes or links) that are critical for the functioning of the system (critical components). Network critical components analysis has been successfully applied in different fields as communication or transportation. For instance, critical analysis is used to identify nodes that must be protected from terrorist attacks in communication networks, in social networks finding critical nodes can be fundamental to reduce the spreading of viruses, and in biological systems, this analysis can be extremely helpful to understand complex phenomena and to find more powerful ways to defend the system from a disease. Nodes and links can be removed using various techniques and different networks exhibit different levels of resilience to such disturbances. Networks can be perturbed simulating the deletion of node/links chosen at random (error removal or failure) or targeting a specific class of nodes/links (removal through intentional attacks). Attacks can be addressed sorting and removing progressively the nodes in descending order of degree or betweenness or the links in descending order of betweenness or range. The network robustness is usually measured by the size of the largest connected component and by the average node-node distance as a function of the percentage of nodes/links removed.The method used here to identify the critical components of gene regulatory networks is based on an ad-hoc definition of network performance, rather than on local node information such as the number of ingoing or outgoing links. Specifically, the importance of a node is measured by the drop in the network efficiency caused by the removal of that node, where the network efficiency E(G) quantifies how efficiently the nodes of the network exchange information. Mathematical and computational details are reported in (Bisiolo et al., 2010).
The analysis of critical components revealed that genes with a limited number of connections could be critical for the structure of the network and that hubs are not necessarily critical nodes. Indeed, about one half of most connected nodes in each considered network were not included in the corresponding list of most critical nodes and genes like BLNK, characterized by a low node degree, were instead critical. These non-hub critical nodes would have been disregarded as putative regulatory targets due to their limited number of connections although they may provide clues to the detection of key regulatory circuits. Finally, the integration of the transcriptional and post-transcriptional levels allowed identifying critical genes for both types of regulatory interactions and dissecting direct critical relationships at transcriptional level from interaction that are instead indirect since mediated by post-transcriptional regulation.