SCIENTIFIC ACTIVITY
Scientific report
The following page reports the scientific activity according to the tasks originally planned for the first 12/18 months of the project. All tasks, planned to be completed within the allotted time, have been addressed. In some areas, results are more advanced than originally planned, especially in the fields of muscle atrophy modeling and of miRNA-based regulation of gene expression.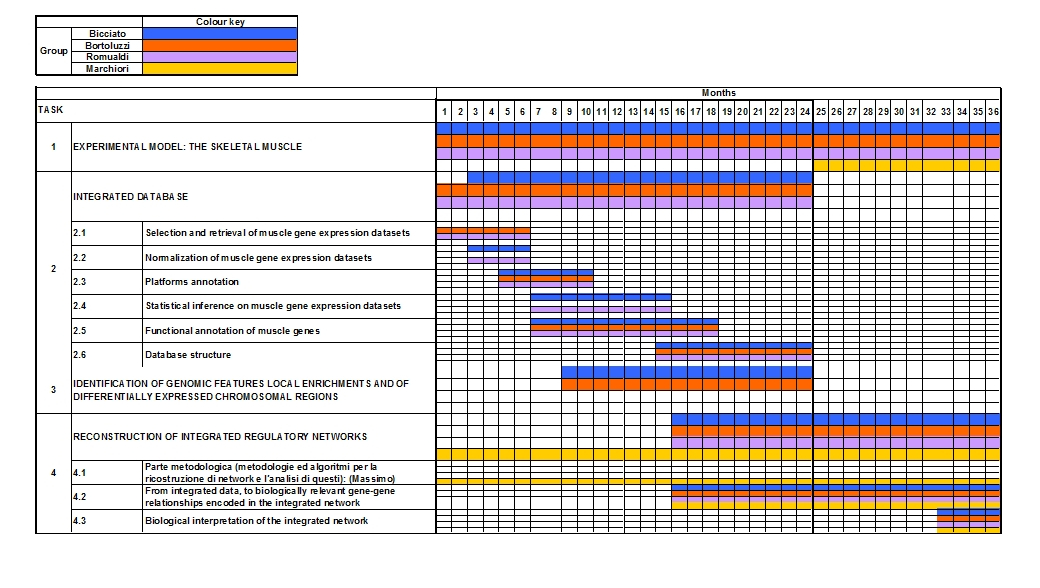
Gantt diagram over 36 months: involvement of applicant groups in different scientific activities and timing for objective accomplishments. (click to enlarge)
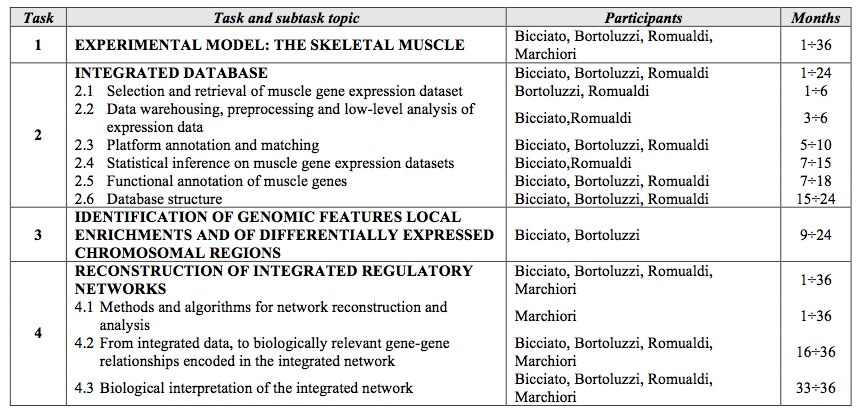
Project tasks, participants, and timing. (click to enlarge)
Task 1. EXPERIMENTAL MODEL: THE SKELETAL MUSCLE
The skeletal muscle tissue constitutes the experimental model and the biological focus of the project, with the applicative aim of investigating and modeling networks of molecular interaction in healthy and diseased muscle cells. As a first pilot-study, previously available gene expression signatures have been analyzed through a meta-analysis approach to decipher gene interaction networks in early and late stages of muscle atrophy. Results from this study have been published in BMC Genomics (Calura et al., 2008).Atrophy is one of the processes responsible of the skeletal muscle mass reduction, as a consequence of many diseases or critical physiological and environmental situations. Atrophy is characterized by loss of contractile proteins and reduction of fiber cross-sectional area. Although in the last decade molecular aspects of several types of atrophy have received increased attention, the fine mechanisms controlling muscle degeneration are still incomplete. In this study, we applied meta-analysis on gene expression signatures pertaining to different types of muscle atrophy (Jagoe et al., 2002; Welle et al., 2003; Stevenson et al., 2003; Lecker et al., 2004; Raffaello et al., 2006; Sacheck et al., 2007) to identify novel key regulatory signals implicated in atrophy. We found a general down-regulation of genes involved in energy production and carbohydrate metabolism and a complete up-regulation of genes for protein degradation and catabolism. Six functional pathways (i.e., TGF-β pathway, apoptosis, membrane trafficking/cytoskeleton organization, NFKB pathways, inflammation and reorganization of the extracellular matrix) occupy central positions in the regulatory network obtained by the integration of atrophy transcriptome and molecular interaction data. Protein degradation pathway is evident only in the network specific of short-term muscle response to atrophy. TGF-β pathway plays a central role with proteins SMAD3/4, cMYC, MAX and CDKN1A in the general networks, and JUN, MYC, RACK1 in the short-term muscle response network.
Our study offers a general overview of the molecular pathways and cellular processes regulating the establishment and maintenance of atrophic state in skeletal muscle and shows how the different pathways are interconnected. This analysis identifies also novel key factors that could be further studied as potential targets for therapeutic purpose. We suggest that SMAD3/4, RACK1, MYC, MAX and JUN transcription factors, whose functions have been studied extensively in tumors but only marginally in muscle, appear instead to play important roles in regulating muscle response to atrophy
Task 2. INTEGRATED DATABASE
The following issues have been addressed in this task:- the development of A-MADMAN, a software tool for the retrieval, annotation and analysis of muscle gene expression data (Bisognin at al., 2009, submitted);
- the selection and retrieval of muscle gene expression datasets;
- the development of custom chip definition files for platform annotation and matching (Ferrari et al., 2007a);
- the critical assessment of different normalization strategies for meta-analysis of gene expression data (Chiogna et al., 2008, submitted);
- the systematic analysis of functional annotation of muscle genes;
- the definition of a novel strategy for the integration of miRNA and mRNA signals.
Task 2.1. Selection and retrieval of muscle gene expression datasets
Data pertaining to a total of 608 gene expression experiments have been retrieved from GEO public repository and used to populate a custom-created database. The database accounts for gene expression data of muscle tissues obtained from healthy individuals of different age, which have been classified in infant, young, adult and old, in normal conditions, comprising untrained and trained people (some samples were taken after different kinds of training exercises), or after immobilisation. Different kinds of muscle diseases are also represented in the integrated database. A custom annotation tag-system, focused on muscle physiology and on selected samples characteristics, has been designed and adopted for sample annotation. Single or multiple samples have been assigned to specific individuals/patients by hand-curate literature mining. Data and metadata were automatically retrieved and organised using A-MADMAN, a novel tool explicitly developed for retrieval, annotation and analysis of muscle gene expression data.Task 2.2. Data warehousing, preprocessing and low level analysis of expression data
The classical meta-analysis approach to gene expression data considers results from each data set and then combines the significance of the test at a posterior level. However, due to the high cost and low reproducibility of many microarray experiments, it is not surprising to deal with a limited number of samples in each study with the subsequent low power of the statistical inference. Therefore, it is of great interest and challenge to retrieve and merge data sets from multiple studies, prior to the statistical analysis, to increase the sample size and the power of the statistical test. To fulfill the lack of software tools for gene expression data retrieval and integration and the methodological gaps in the meta-analysis approaches, we i) developed a novel software, named A-MADMAN, and ii) critically assessed several normalization strategies for meta-analysis.A-MADMAN (Annotation-based MicroArray Data Meta ANalysis tool) is a software tool to retrieve, annotate and manage the muscle project data (Bisognin et al., 2008, submitted; http://compgen.bio.unipd.it/bioinfo/amadman/). The rationale behind this tool is automating the tedious and error-prone steps necessary to setup a working environment for the meta-analyses of expression data. From a technical point of view, A-MADMAN is a web application written in the python, based on the Django web framework with GNU R as a backend. A-MADMAN supports a collaborative working style for local or geographically dispersed teams through LAN or Internet deployment options (GNU/Linux recommended), but can also be used by a single researcher on his Windows® Personal Computer installing an all-in-one package that bundles all required dependencies except R.
At the current state, A-MADAN offers the following features:
- automatic download and organization in a proper and transparent file-system hierarchy of GEO raw data and annotations given a textual configuration file;
- automatic import of metadata from GEO records into a local relational database to assist subsequent manual annotation and selection of samples;
- flexible annotation of samples through user-defined tags;
- selection of samples to be analyzed using an arbitrary complex logical query on tags, e.g., young AND dystrophy AND NOT (Becker or limb-girdle). Once selected and tagged, samples are placed in an object called basket;
- low level analysis of expression data using the R backend powered by Bioconductor packages. The basic analysis work-flow comprises the following steps:
- creation of a working directory named after the analysis;
- copy of the selected CEL files to the working directory;
- signal reconstruction using RMA algorithm and custom chip definition files (Ferrari et al., 2007a); transfer of metadata to Bioconductor ExpressionSet objects;
- integration of different chip platforms using pre-calculated masks based on chip annotations;
- normalization of the final ExpressionSet with distribution transformations (Chiogna et al., 2008, submitted)
As regarding the integration and normalization of different datasets, we focused on normalization strategies for meta-analysis studies. Recently, a few papers (Jiang et al., 2004; Warnat et al., 2005; Kim et al., 2007) investigate the possibility to merge microarray data from different laboratories with different protocols. These studies showed that different datasets, even if from the same technology (e.g. Affymetrix GeneChip), cannot be merged at a raw level and proposed different transformation (i.e. normalization) of the data to allow the integration of the expression values. We evaluated the performance of the proposed methods on real microarray data, both from a descriptive and from an inferential point of view, in order to apply the best method in the normalization step of A- MADMAN. The descriptive evaluation has been done through a cluster analysis of samples and observing the correlation of correlations as defined in Garrett- Mayer et al. (2008). To have an estimate of the impact of the normalizations to the subsequent analyses, we also tested the differential expression (moderated t- test). In descriptive analyses, the normalization proposed by Kim et al. (2007) was the one showing the best performance, in terms of higher correlation between samples and minimum inter-laboratory variability. Unfortunately, the statistical test for the differential expression after Kim's procedure showed very poor specificity, due to the under-estimated variance of the data. This incorrect estimate is probably due to the nature of the transformation, which yields dependencies between observations. From an inferential point of view, quantile-based methods (Warnat et al., 2005; Kim et al., 2007) produced much more robust results, allowing data to be integrated prior to any statistical analysis. We noticed that, for Affymetrix data, correcting the background and summarizing probe expressions independently for each data set yields better results than doing the same globally. The final normalization step of the expression set is a crucial issue, since the direct integration of different datasets may result in misleading outcomes, due to different experimental conditions, laboratory-dependent bias, etc. Among the various normalization techniques which have been proposed for microarray meta- analysis, we selected, through a comparative evaluation study (Chiogna et al., 2008, submitted), the distribution transformation (Jiang et al. 2004). The reference empirical distribution function, used in the quantile normalization, has been identified as the median expression across the experiments with the largest number of available probesets. Deeper analyses have been already planned to test other normalization models with the aim to identify the optimal strategy for data integration
Task 2.3. Platform annotation and matching
The integration of different chip platforms is carried out using custom chip definition files (CDF) and annotations. We developed a novel set of custom Chip Definition Files (CDF) and the corresponding Bioconductor libraries for Affymetrix human GeneChips, based on the information contained in the GeneAnnot database (Ferrari et al., 2007a). GeneAnnot-based CDFs are composed of unique custom-probesets, including only probes matching a single gene. The use of GeneAnnot CDFs (GA_CDFs) is intended to improve gene-centered analysis of transcriptional data where the focus is in the reliable identification of genes, rather than individual transcripts, that are differentially expressed.A-MADMAN supports a set of Affymetrix platforms and allows the user to adopt different, gene-centered CDF packages. In a given meta-analysis project, a subset of all supported platforms will be represented. Each platform, according to selected CDF, will contribute expression data for a platform CDF-dependent list of probesets (or meta-probesets). The CDF annotation of all platform-specific probesets is used to establish a non redundant list of gene-centered integrated_probesets, each corresponding to one or more platform-specific probeset. If a gene of an integrated_probeset, is represented in more than one platform, the expression values of corresponding platform-specific probesets are averaged and an integrated expression vector is produced.
Task 2.4. Statistical inference on muscle gene expression datasets
Although several supervised methods (e.g., moderated t-test) have been already applied to evaluate the impact of the various normalization strategies, the computational analysis of the retrieved and normalized datasets has been postponed of six months as compared to the original working plan. This is entirely due to an underestimation of the time needed to develop, test and apply all the software tools, the annotation schemes and the low-level procedures for the meta- analysis. Nevertheless, several tools for unsupervised and supervised analysis (i.e., Principal Component Analysis, Canonical Variate Analysis, SOM, k-mean, hierarchical clustering, moderated t-test, SAM, and rank-product) are already in use.In addition to what originally planned for this task, we implemented a bioinformatics pipeline for the integrated analysis of microRNAs (miRNA) and genes expression data and for studying non-conventional roles of microRNA regulation through promoter targeting. This addition finds its rationale in the recent popularity achieved by miRNA as regulators of genomic transcription and by the availability of miRNA expression data.
MicroRNAs are an abundant family of small non coding RNAs that play an important role in genes expression regulation. By base pairing to mRNAs, microRNAs control genes expression at post-trascriptional level, regulating the stability of RNA messenger (mRNA) and their translational efficiency. MiRanda, TargetScan, Pictar and Pita are the most popular algorithms for predicting miRNAs targets genes, based on sequences complementary. In spite of differences in design and efficiency, miRNA-mRNA relationships predicted using each of these programs include many false positive. Integrated analysis of miRNA and genes expression data may provide a criterion to identify the subset of miRNA-mRNA relationships more likely functional in a specific biological contest. This may be achieved using GenMiR++, a recently developed software tool, which acts like a filter and identifies more reliable miRNA-mRNA relationships (Huang et al., 2007). GenMiR++ combines predictions with miRNA and mRNA expression profiles, under the assumption that, since miRNAs down-regulate mRNAs, expression profiles of miRNA and real targets are expected to be anti-correlated. GenMiR++ outputs an adjacency matrix, where each value indicates the strength and reliability of each miRNA-mRNA relationship based on their expression profiles.
Since paired miRNA-mRNA expression data are not available yet for the experimental model of the project, we developed and tested the pipeline on miRNA and mRNA expression data from myeloid suppressor cells and from multiple myeloma samples (data courtesy of Dott. V. Bronte, IOV-Padova, and Prof. A. Neri, University of Milano-Milano). The computational framework comprises the integrated analysis of expression data using GenMiR++ and the creation of miRNA- mRNA regulatory network using Pajek (Batagelj and Mrvar, 1998). We also developed methods to walk along the network arcs and to visualize corresponding miRNA and gene expression profiles. Moreover, we constructed a multi-relationships network of miRNA and genes, in which arcs connecting miRNA and gene nodes represent regulatory relationships, whereas gene-gene edges represent co-expression relationships. The study of these networks and the identification of inner islands allowed identifying gene groups regulated by sets of shared miRNAs and miRNA sets regulating similar genes. To understand how important miRNAs are in post-transcriptional gene regulation, we computed the pair-wise correlation coefficient of expression for pairs of genes which are common targets of a miRNA. This correlation coefficient indicated that co-expression is significantly higher in genes regulated by the same miRNAs than in genes not sharing target sites (median of pair-wise Spearman correlations 0.51 and 0.037, respectively; p-value=0).
In addition to these results, we tried overcoming an intrinsic limit of GenMiR++, i.e., the assumption that expression profiles of miRNAs and of target mRNAs are expected to be anti-correlated. As such, we started investigating the non-conventional roles of miRNA regulation on mRNAs and, in particular, the gene expression induction due to a binding between a miRNA and the gene promoter. Indeed, a recent work by Place et al. (2008) reports that a miRNA (e.g., hsa-mir- 373) can target the promoter of two genes, causing a 5-fold increase in their expression. The authors, using the target predictor algorithm miRanda (Enright et al, 2003), identified two mir-373 targets in the promoters of E-cadherin and CSDC2. We examined the regions where the pairings occurred with the Transcription Element Search System TESS (http://www.cbil.upenn.edu/cgi-bin/tess/tess) and discovered that in the E-cadherin promoter, the miRNA pairing region is also a binding site for the transcription factor ZEB1, which is reported to repress the E-cadherin gene (Guaita et al., 2002). Consequently, the miRNA causes a de- repression, interfering with a repressor. No similar action was found for the reported miRNA binding site in the promoter of CSDC2. This suggests that miRNAs may act in two ways in inducing gene expression: i) interfering with a repressor or ii) acting as a promoter, in a yet unknown manner. This latter action may or may not require a protein complex analogue to RISC and requires also to denaturize the DNA to permit the pairing between the miRNA and the DNA. Another possibility is that the miRNA acts without a complex. We examined gene expression data in cells after miRNA transfection to study the presence of miRNA targets in the promoters of genes that were over-expressed after such transfection. We used data from 2 studies, i.e. Baek et al. (2008) and Lindsley et al. (2007). For each of the 5 transfected miRNAs, we selected the transcripts with an expression fold change greater than 2 and extracted the promoters of the selected genes from a database containing 15,138 promoters collected by the our group for a parallel study (http://compgen.bio.unipd.it/MoDi/). Examining the 2 targets identified by Place et al. (2008), we noticed that both targets presented a perfect match of the seed and a high score. Therefore, we first searched for targets requiring a similar match and studied score and position of these targets. A Python script implementing an algorithm similar to TargetScan (Lewis et al., 2003) was developed for this purpose. This algorithm first searches for perfect matches of the seed and then the best local alignment of the entire miRNA sequence. The search was performed in the five promoters groups and in the entire promoter set (referred to as background). For each miRNA, we first examined the correlation between the number of targets in each target gene and its expression fold change drawing a dispersion diagram (number of target vs. fold change) and a box plot (fold change of genes with no targets vs. fold change of genes with 1 or more targets). No significant correlation was found. Then, we divided each promoter sequence in 3 regions with equal length and considered the targets in each region. In the background, the distributions of the targets appear to be almost uniform whereas in some of the over expressed promoters the distribution appears to have a different shape. Finally the score distribution was calculated in the miRNA- targeted promoters and in the background. The absence of a significant enrichment in targets between the over-expressed genes and the background suggests that a perfect match of the seed may not be important for the miRNA action here considered. Instead a high affinity pairing, regardless of the seed, should be required.
Task 2.5. Functional annotation of muscle genes
The availability of experimental data measuring the abundance of protein-coding transcripts and miRNAs in the same biological samples provides the opportunity to investigate the details of post-transcriptional regulation. The setup of most experiments of this kind is however based on traditional microarray platforms, a decision that in this context poses two issues. First of all such devices were designed a number of years ago; since then our knowledge of genome annotation has improved dramatically so that a significant fraction of microarray data are no longer accurate or associable to the originally intended genes. Moreover, strong evidences have been presented in the literature backing the hypothesis that the regulatory interactions between messenger and miRNAs are limited to the 3' UTR regions of the formers. This would mean that such regulation is actually transcript-specific and that microarrays associating each of their measures to a gene (rather than to only one of its transcripts) may not provide a sufficient resolution to investigate the problem at hand.With these issues in mind, and in addition to the development of custom chip definition files (Ferrari et al., 2007a), we started a survey of the literature looking for microarray datasets studying the interaction among miRNAs and protein-coding transcripts. We built a unified framework for the retrieval and the pre- processing of such data (different microarray platforms require different normalization strategies, at this stage). To solve the annotation mismatch due to the change in the knowledge of gene locations, we developed a fast algorithm to align probe sequences to the latest genome builds. From its results we can subdivide microarray probes in three different categories: probes that do not align to known genes, probes that align to multiple genes and probes that are specific to a single gene. We kept only the last category and organized them into groups (called probesets) related to the same gene. The definition of these probesets will let us assess the efficacy of traditional microarray platforms in the study of miRNA-mediated post-transcriptional regulation. Specifically, we will quantify how gene- centric design (as opposed to transcript-centric) limits the microarray sensibility. Following well established analysis pipelines, we plan to search for anti- correlations among the expression profiles of pairs of protein-coding and miRNAs that have been predicted to interact. We will repeat such analysis twice, first using a gene-centered microarray annotation, then using a transcript-based variant. Given the nature of the miRNA interaction, we expect to find a much higher recall from the second procedure, indicating the need of using more sensitive platforms (such as exon microarrays) to investigate this kind of phenomenon.
Task 2.6. Database structure
Although A-MADMAN contains in itself all the elements to implement the database structure, this task, planned between the 15 and the 24 month, is still under development.Task 3. IDENTIFICATION OF GENOMIC FEATURES LOCAL ENRICHMENTS AND OF DIFFERENTIALLY EXPRESSED CHROMOSOMAL REGIONS
In this task we enhanced a methodology to detect density variations of specific features along the genome sequence and a tool for the detection of chromosomal regions with structural and transcriptional imbalances from the integrated analysis of gene expression and other types of genomic information (e.g., gene dosage). As to the identification of genomic features local enrichments, we updated a previously developed computational tool (Coppe et al., 2006; http://telethon.bio.unipd.it/bioinfo/reef/). Specifically, REEF (REgionally Enriched Features) software allows identifying genomic regions enriched in specific features, such as a class or group of genes homogeneous for expression and/or functional characteristics. The method uses test statistic based on the Hypergeometric Distribution, applied genome-wide by a sliding window, and adopts the False Discovery Rate for controlling multiplicity. The algorithm is coded in phyton and contains modules for descriptive analyses, statistical computations, and interactive display of results. While waiting for the lists of differentially expressed genes, identified by the meta-analysis of muscle datasets, we tested REEF on the study of genomic distribution of tissue-specific genes and on the preliminary analysis of gene differentially expressed in given myeloid cell lines (Ferrari et al., 2007b).We also expanded the Locally Adaptive Statistical procedure (LAP, Callegaro et al., 2006), a tool we previously developed for the identification of differentially expressed chromosomal regions. This update resulted in a bioinformatics procedure that allows the integration of copy number, obtained from SNP mapping arrays, with transcriptional data, the identification of genome-wide, concurrent alterations of copy number and regional gene expression in single samples, and the extension of the integrative analysis to entire datasets (Bicciato et al., 2008, submitted). These two issues are achieved in three steps, i.e. i) the statistical estimation of copy number and transcriptional scores at common gene positions from microarray probe-data; ii) the identification of Significant Overlap of Differentially Expressed and Genomic Imbalanced Regions (SODEGIR) on a single-sample basis; and iii) the aggregation of SODEGIRs from different samples to obtain global signatures of phenotypes. We applied the whole methodology to SNP mapping and gene expression data obtained by Affymetrix arrays from normal and pathological samples. All results are available at the SODEGIR Web Site (http://www.xlab.unimo.it/SODEGIR).
In the next phase of the project, the various algorithms and software packages will be applied to identify specific classes of genes which are i) always expressed in muscle; ii) differentially expressed in specific conditions or groups of conditions; iii) co-expressed in the considered conditions.
Task 4. RECONSTRUCTION OF INTEGRATED REGULATORY NETWORKS
4.1. Methods and algorithms for network reconstruction and analysis
We have investigated the state of the art and the possible ways to apply the complex systems approach to the analysis of information about regulatory and functional gene-gene interactions/similarities. The major focus of the complex systems approach lies in studying the interaction between the components of the system, so to find patterns and relationship. We have started to study how to model the gene-gene interaction patterns into networks, via weighted and un- weighted matrixes. The two streams (weighted and un-weighted) are both interesting, as the first abstracts from the possible noise and is targeted to identifying the fundamental skeleton architecture of relationships, whereas the second can be used to fine-tune the system, in the presence of multiple attractors (i.e., of a more complex system interaction), and to help also finding, via back-tuning, what are the most relevant relationships in the system, and in what proportion. Therefore, one promising line of research that we will pursue is to apply these transformations to the actual dataset developed by the other components, and then proceed with the complex systems analysis.We have also identified promising measures that can be later helpfully used to such networks. One is the classic measurement of the efficiency of the network, together with its small-word degree: this will help identify whether there is a structural behaviour that is pertinent to complex systems, in the form of scale-free interactions. We also identified another promising line of analysis, i.e., de-structuring the network via attacks (in some sense, simulating pathogen effects) and then studying the effects these attacks have on the networks. This can help a lot in order to make hidden structures present in the networks, in the form of higher- order degrees of interactions, surface up and therefore give important indications on non-local forms of gene interactions. We have also analyzed the possibility of applying evolution techniques to the networks, so to simulate, to some extent, the possibility of look-up in the future, and check whether, and to what extent, there is an underlying evolution process that has somehow shaped the present form of the human muscle and tissues.
Task 4.2. From integrated data, to biologically relevant gene-gene relationships encoded in the integrated network
The integrated study of co-expression, co-regulation, co-localization and functional similarity may help in understanding basic and general rules governing genomic expression. We developed a computational framework for the identification of putative regulatory motifs in promoter sequences of Selected Groups of Genes, SELGPi, as compared with a reference set of promoters (Coppe et al., 2008; http://compgen.bio.unipd.it/MoDi/). The first step of the framework searches approximate patterns overrepresented in a given SELGPi. Significant patterns are then grouped with k-medoids clustering and resulting motifs are compared with known TF binding sites, from public databases. A reference set of 15,138 human genes, genomic positions and promoter sequences were used as reference set of promoters (REFGP). This database of promoters has also been used for the analysis of miRNA-mRNA non-conventional targeting and constitutes an applicative deliverable of the project.The motif discovery framework was applied to the promoters of three types of selected groups of genes, obtained by analyzing in an integrated way expression data and genomic positions of genes along myeloid differentiation. Specifically, the three groups of genes are: i) co-expressed genes (CEG); ii) co-expressed and co-localized genes (CER), i.e. sets of neighbouring genes similarly expressed during myelopoiesis; iii) genes included into two co-expressed meta-chromosomal regions (CEMR) obtained by grouping CER according to the similarity of expression patterns. Results show a remarkable relationship between gene position, function and expression in myeloid cells. The inclusion of genes into CER or CEMR suggests a possible relationship among genes, likely related to different levels of epigenetic regulation. Significant motifs were identified in promoters of CEG, of CERG and of CEMRG. The 20% of them are similar to known TFBS. Results of motif discovery in SELGPi were integrated with biological annotation on gene relationships. In particular, gene-sets associated to over-represented motifs recognized by a transcription factor with a known role in myelopoiesis were mapped together with the putative regulator(s) to KEGG and Biocarta pathways. This allowed the identification of interesting examples of regulators and regulated gene products involved in pathways or regulatory circuits. It is also worth note that significantly more motifs are found in the promoters of genes co-expressed and co-localized (CER) than in groups of simply co-expressed genes (CEG).